As a plastics recycling professional, it's possible that you've heard of OEE, or Overall Equipment Effectiveness. For those that have, it's an often misunderstood measure of equipment performance. If you haven't heard this term before and are operating a plastics recycling plant or are considering investing in plastics recycling machinery, it's a concept that you should fully understand. The reason is that OEE is the KPI (Key Performance Indicator) for production machinery that is most closely related to facility profitability.
What is OEE?
Overall Equipment Effectiveness (OEE) is a Lean Manufacturing and Continuous Improvement KPI (Key Performance Indicator) used in manufacturing facilities around the world. Monitoring OEE is considered a best practice across industries, complementing other machinery downtime tracking and reduction systems as well as throughput measurements. Companies that implement production improvement methodologies such as Lean Manufacturing utilize OEE to benchmark their operations and to gage the impact of production improvement efforts.
The concept of OEE was developed in the 1960s in Japan by Seiichi Nakajima. It was intended to be an extension of the Kaizen system. The power of OEE is that it consolidates numerous KPIs into a single score that can be tracked over time and compared as a benchmark to similar production machinery and facilities. This score gives a clear indication of equipment efficiency, whether a single machine or an entire factory, is operating with high effectiveness and needs little process improvement or operating with less effectiveness with room for improvement.
OEE TERMS
Understanding OEE requires familiarity with relevant terms.
OEE is defined as the percent of fully productive work accomplished during a planned production time. It is an all-encompassing percentage, taking into account all forms of production losses.
In the simplest terms, it is the ratio of fully productive time to planned production time.
There are several units of time referred to when discussing OEE, with a few units being subsets of one another:
-
-
- All Time – The entire duration of the work day, whether equipment is running or not
- Planned Production Time – All Time minus the schedule loss (time when equipment isn’t scheduled to be running), or all the time the factory is meant to be actively manufacturing
- Run Time – Planned production time minus the availability loss (loss derived from planned and unplanned stops during production time), or the duration of time during which the equipment is actively producing value, ignoring small stops and idling
- Net Run Time – Run time minus the performance loss. This is the most detailed measure of the time loss due to equipment not functioning at optimum capacity or being down.
- Fully Productive Time – The net run time minus the quality loss. This measure takes the net run time and subtracts wasted time during production when defective product is produced.
-
Fully productive work refers to work that directly creates value, not including maintenance and changeout, or more simply the work completed during fully productive time.
Manufacturing losses fall into categories known as The Big Six Losses. They include:
-
-
- Planned Stops – Periods of changeover, setup or a make-ready event during which no value is being produced
- Unplanned Stops – Any stop due to equipment failure that halts production
- Slow Cycles – Any cycle that takes longer than the ideal cycle time (the theoretical shortest time during which a discrete item may be produced)
- Small Stops – Also known as minor stops or idling, these are any pauses in production that are not significant enough to be tracked as stop time.
- Startup Loss – Also known as reduced yield, this includes all defective parts produced from startup until equipment reaches stable or steady-state production.
- Process Loss – Any defective parts made once production is steady-state
-
The Big Six Losses are valuable and important to understand, because OEE measures productive manufacturing based on three metrics:
-
-
- Quality – The percentage of faulty parts produced during production time
- Performance – Speed of production compared to the theoretical fastest time per part
- Availability – The amount of downtime (planned or unplanned) during a scheduled production time
-
calculating OEE
Now that we’ve introduced these terms, let’s discuss how OEE is calculated.
The three metrics OEE measures can be simplified as follows:
Availability = Run Time / Planned Production Time
Performance = Actual Cycle Time / Ideal Cycle Time
Quality = Good Products / Total Products Produced
Calculating OEE simply requires multiplying the metrics:
OEE = Availability * Performance * Quality
Mathematically, this means that the value of OEE will be less than or equal to the lowest metric value. That’s because the greatest that each value can be is 100%, meaning that if Performance were 85% and the other two metrics were 100%, the OEE would be 85%.
INTERPRETING OEE
With the definitions to help understand OEE listed above and the calculation of OEE clearly described, it’s time to understand why OEE is relevant in manufacturing. First and foremost, OEE can be taken on multiple scales, from an individual machine to an entire facility. This allows managers to pinpoint areas for improvement across their operations or within areas or particular lines or even specific machines.
A 100% OEE score is, of course, the theoretically highest output and the ideal situation, indicating that no faulty parts are produced, machines are operating at their maximum possible speed and there are no stops in production. However, this is an impossibility with current manufacturing technology.
Alternatively, a 0% OEE score represents a total shutdown of production. This only requires one of the metrics to be at its worst value. For example, if Performance and Availability are 100% but quality is 0%, OEE is 0. If all parts produced are faulty or the machines are not operating due to downtime or any other issue, this will also trigger a 0% OEE score.
Realistically, an OEE of 85% is considered world class for discrete manufacturing. A 60% OEE is considered average, with room for improvement. 40% isn’t uncommon but indicates that the manufacturer isn’t measuring metrics to drive improvement.
IMPROVING OEE
Improving OEE requires commitment, time and large amounts of data relating to production time, speed and quality before benchmarks can be understood and improvements made. The largest barrier to measuring and improving OEE is the collection of accurate data. Capturing operating data manually has been found to distract operators and actually can contribute to lower scores. Alternately, humans also can have a bias to reporting higher scores so inaccurate data may be produced if collected manually. Manual collection of large amounts of data in real time can also be costly if additional resources are needed to monitor machinery while it’s operating.
That’s why best practices for establishing an accurate OEE baseline is to use IoT (Internet of Things) technologies which utilize sensors directly connected to machinery and report analytics through an app or browser software. This removes the cost of manual collection, removes reporting bias and errors and enables quick and easy analysis.
EREMA has released a new application called BluPort. Within the BluPort application is a Key Performance Indicators module.

The EREMA BluPort Application Homepage
The Key Performance Indicator Module provides near real time performance data including OEE of your EREMA plastics recycling machinery.
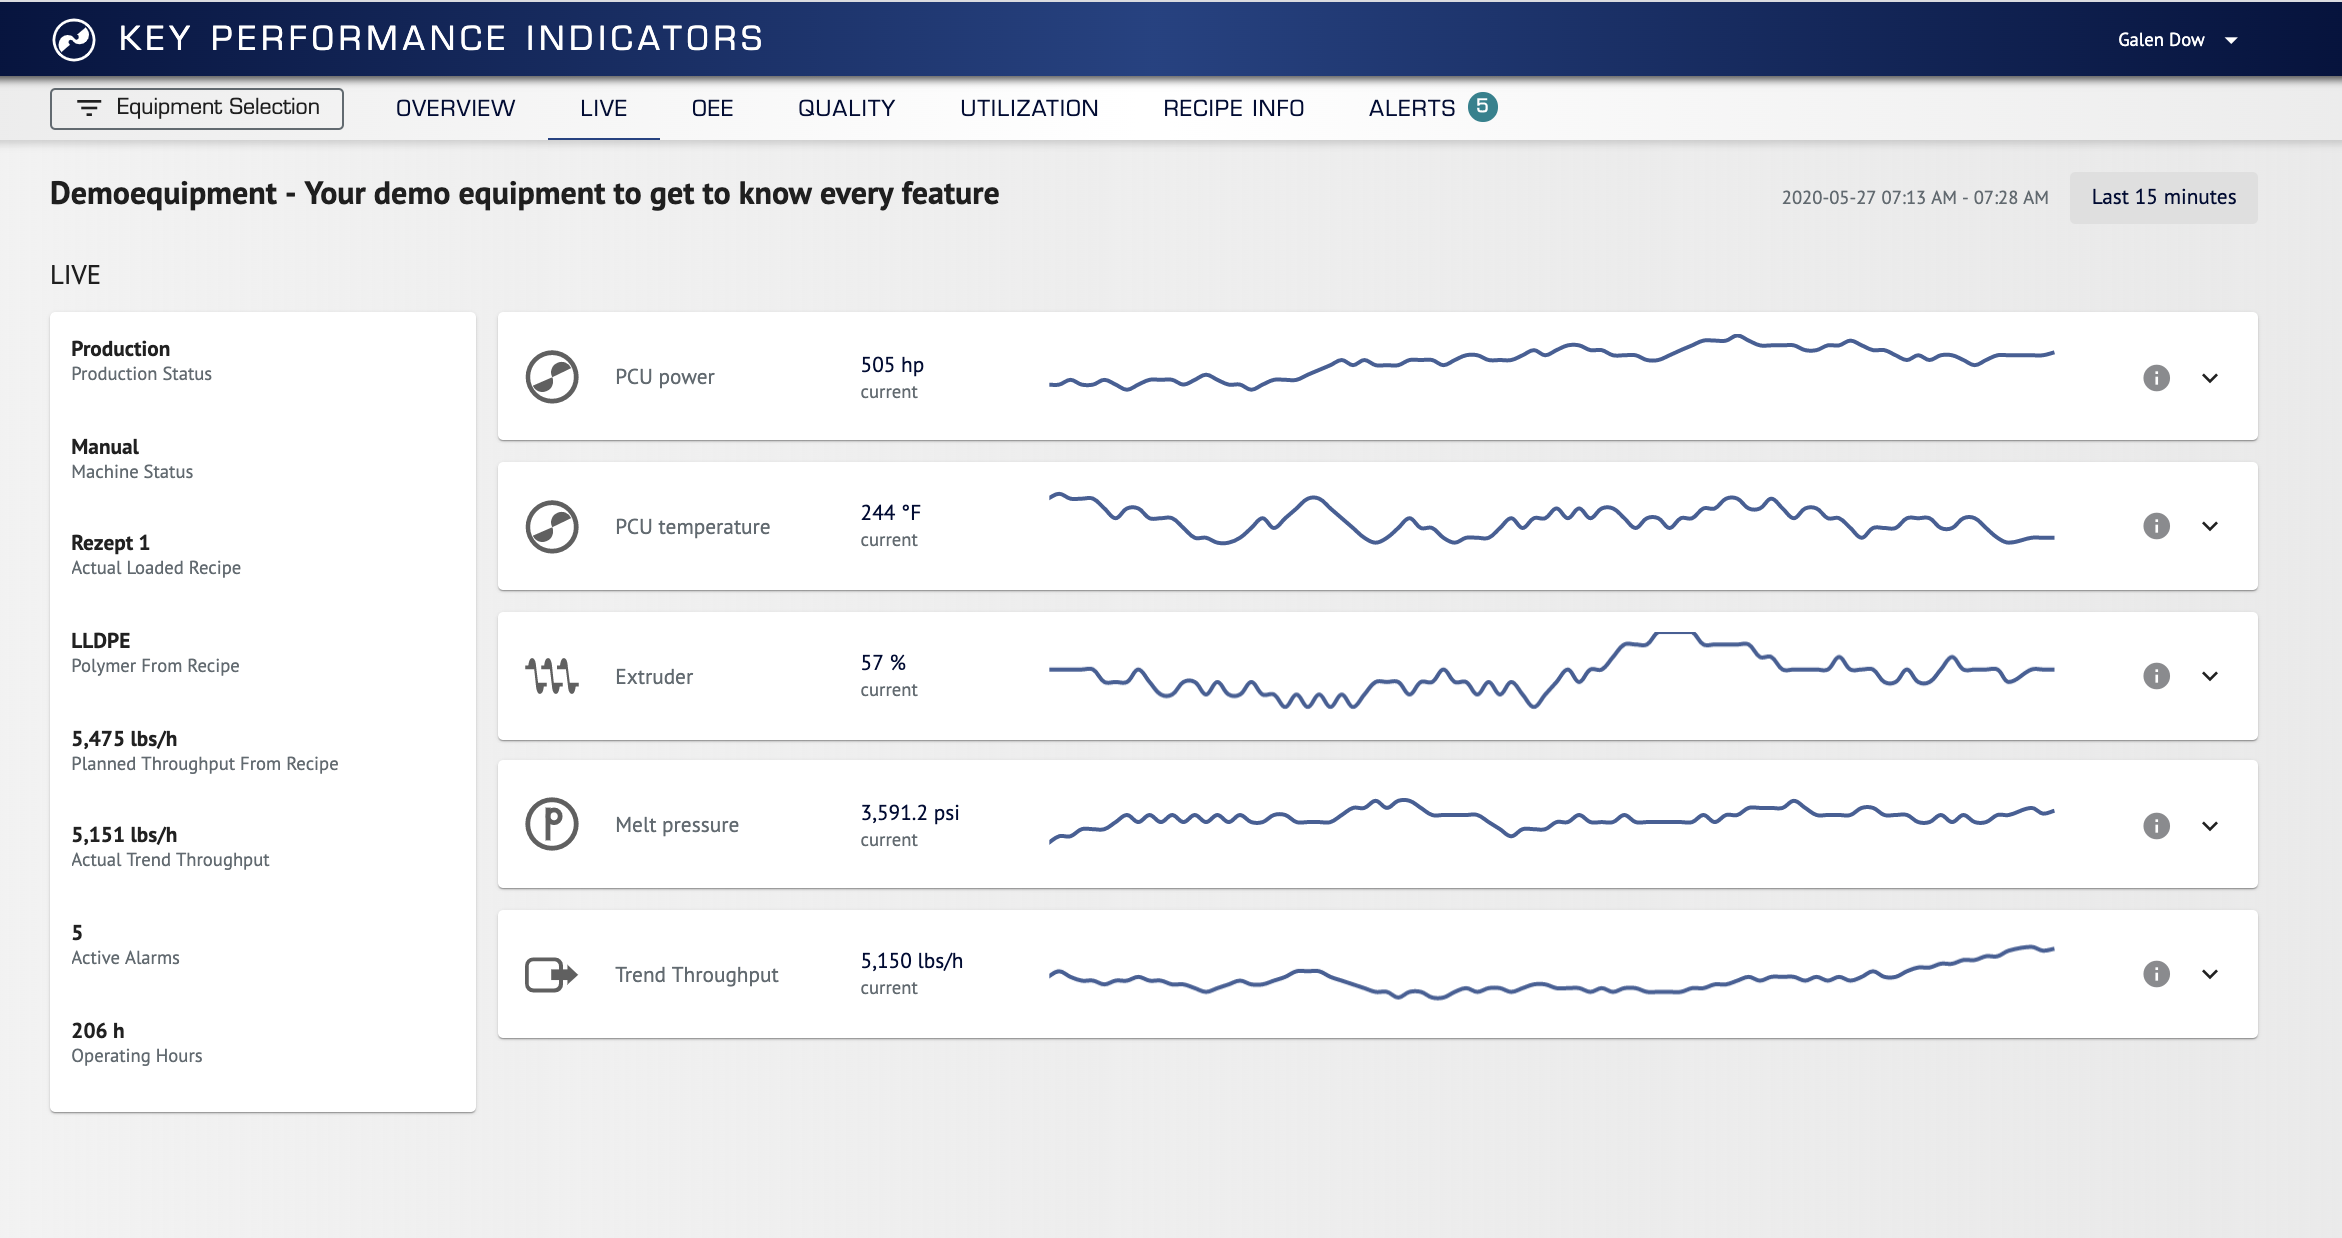
The BluPort KPI Menu Shows the KPIs available in Near Real Time
The EREMA BluPort application provides at-a-glance value for OEE and important trend information.
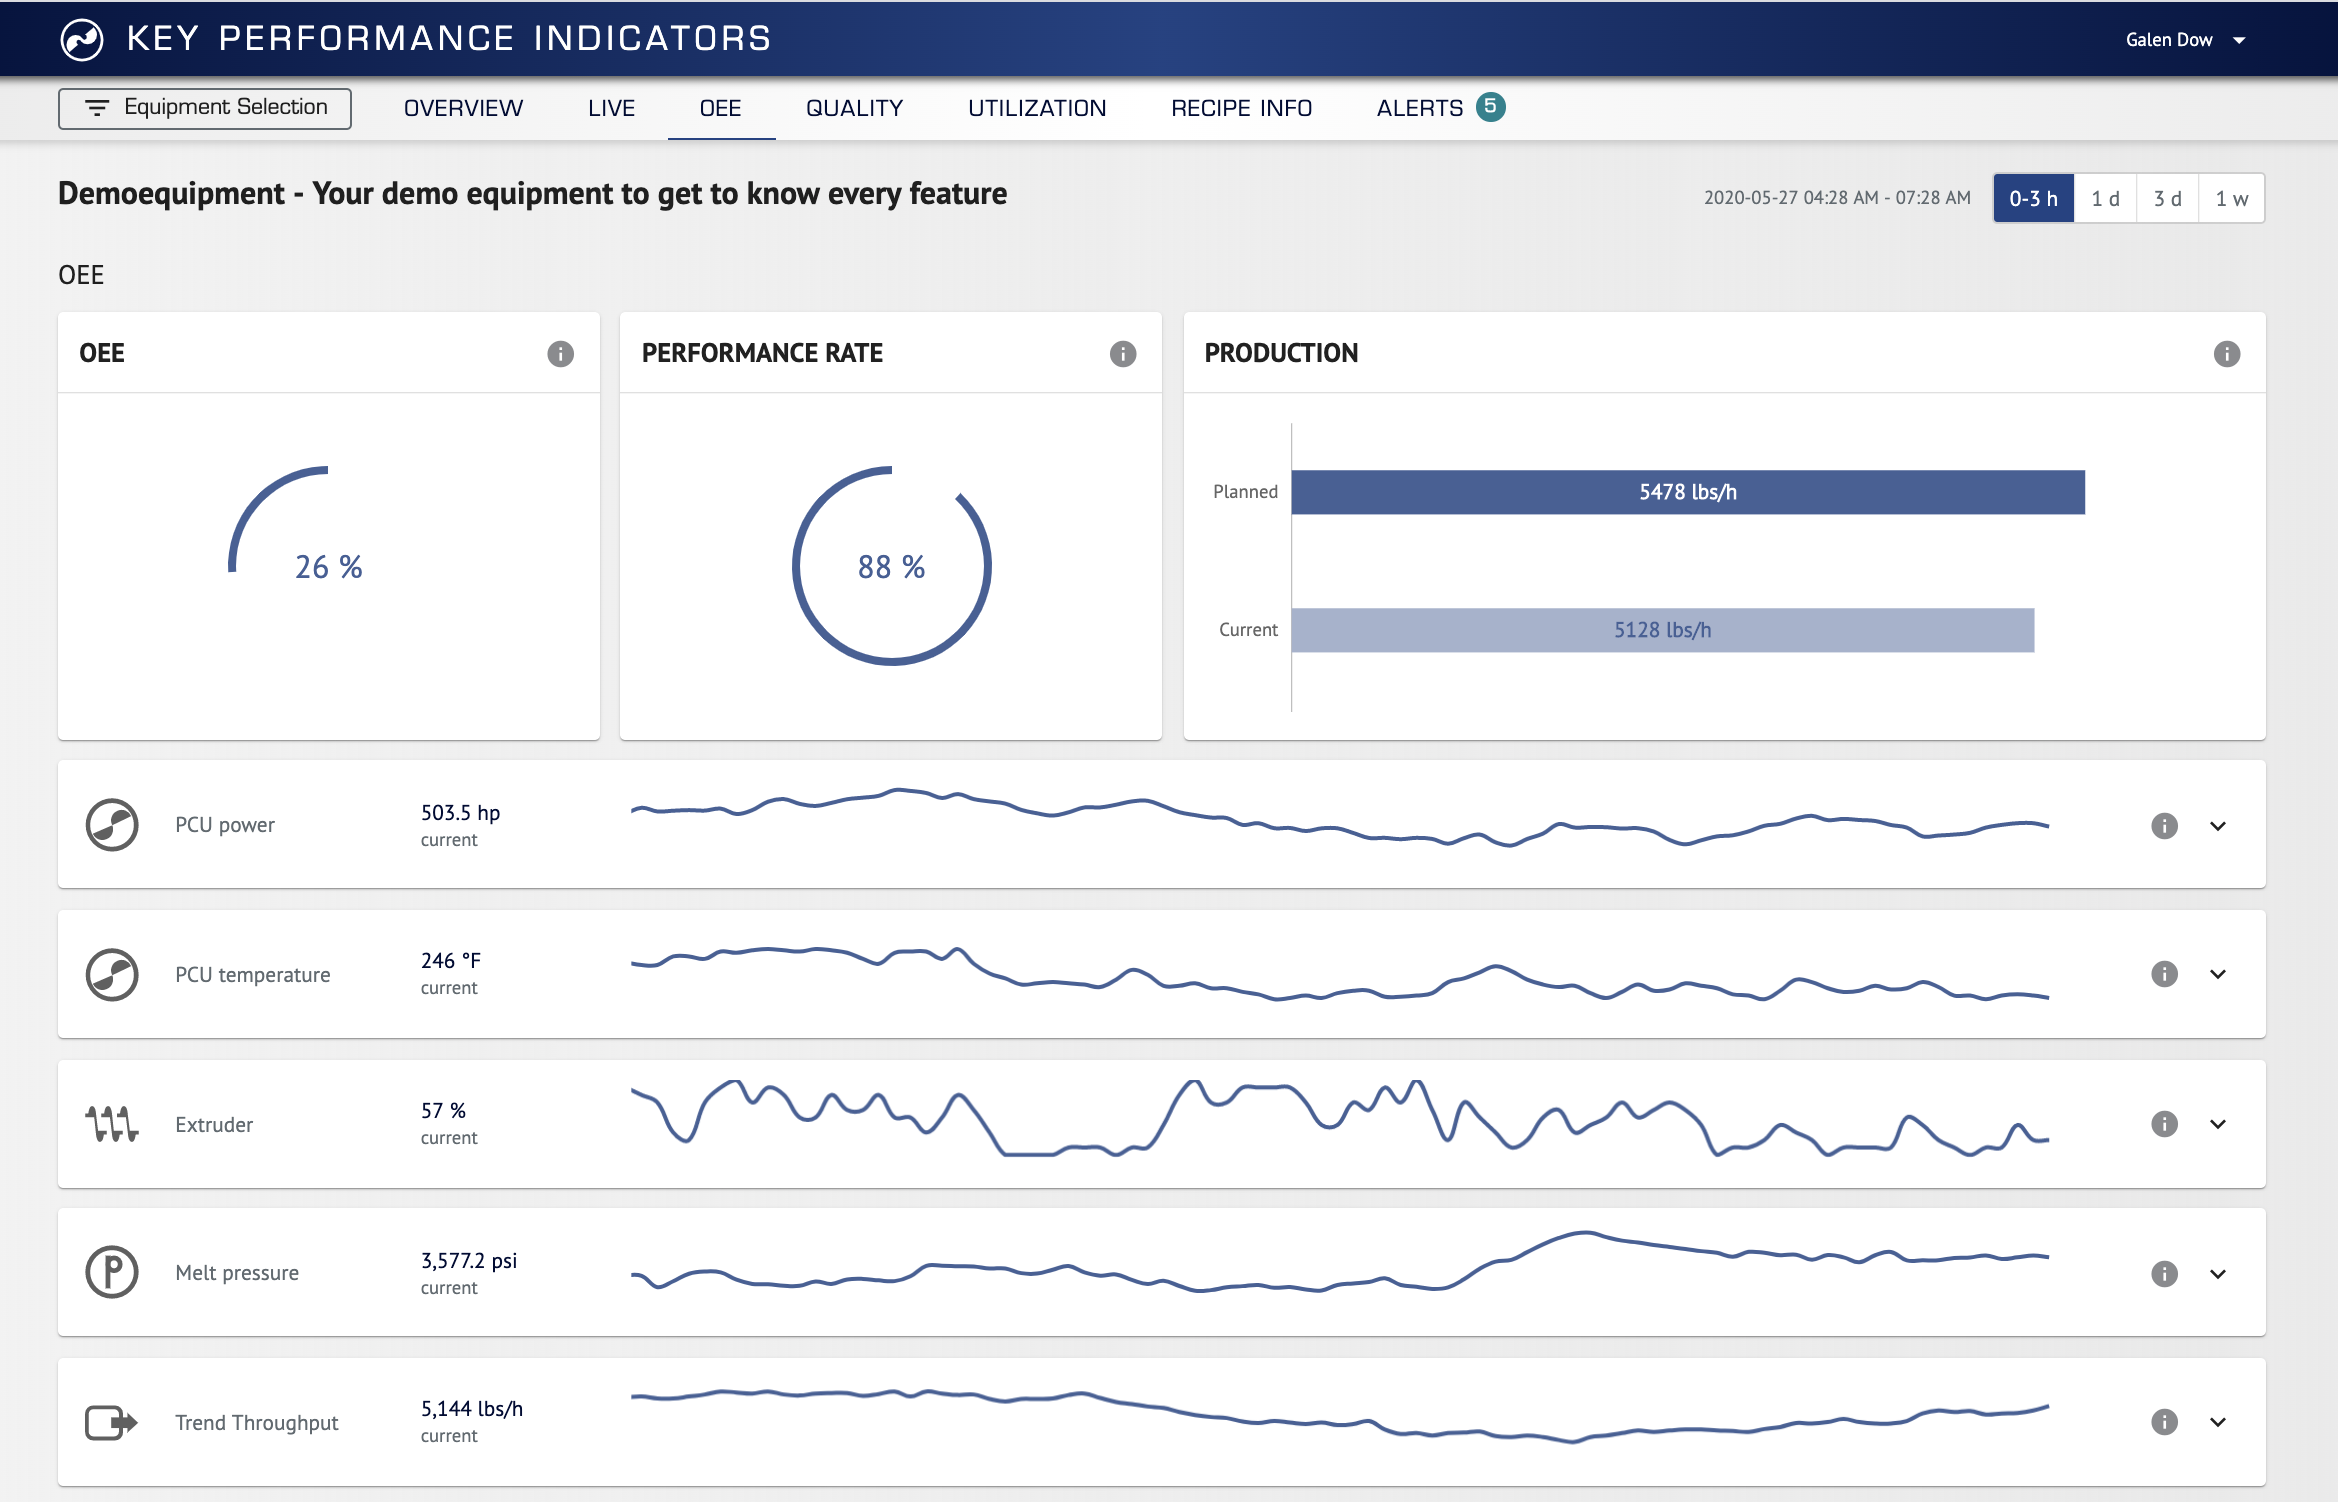
Above Data is for Demonstration Purposes Only and Not Indicative of Actual Machine Performance
With accurate data reported in an easy to understand dashboard based upon periods of time that you select, you can measure and optimize the value of your investment in plastics recycling technology.